


The reference buyback prices mentioned above fluctuate based on timing and market conditions.
Furthermore, prices vary depending on the shape/form of the item. Please contact us by phone for detailed inquiries.
Visit a Specialized Purchase Store Otakaraya to Sell and Appraise Your
Gold
Historical charts for reference gold buyback prices.
We provide period-specific charts for gold rates (per gram). Please refer to the 6-month or 1-year trends in addition to today's rates.
undefined (SGD/g)
※Scroll the headings to select.
*Displays market rates as of 08:30.
These are reference prices from our Japan head office. The actual price may differ. The reference buyback prices mentioned above fluctuate based on timing and market conditions. Furthermore, prices vary depending on the shape/form of the item. Please contact us by phone for detailed inquiries.
Historical Gold Buyback Rates by Year
This section displays the highest, lowest, and average buyback prices (per 1g of ingot) for each respective year.
| YEAR | MAX | MIN | AVG |
|---|
*Displays the highest values within the gold market as of 09:30.
These are reference prices from our Japan head office. The actual price may differ.
Prices vary by shape and quality; please call for details.
Would you like to know
the value of your gold
and precious metals?
the value of your gold
and precious metals?
Free appraisal
by "Otakaraya"
by "Otakaraya"
the high-price
purchase
professionals.
purchase
professionals.
Available 24/7 for free!
Get an appraisal with just one photo!
Consultations are very welcome!
Get an appraisal with just one photo!
Consultations are very welcome!
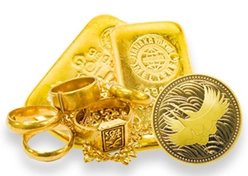
Gold Reference Buyback Price
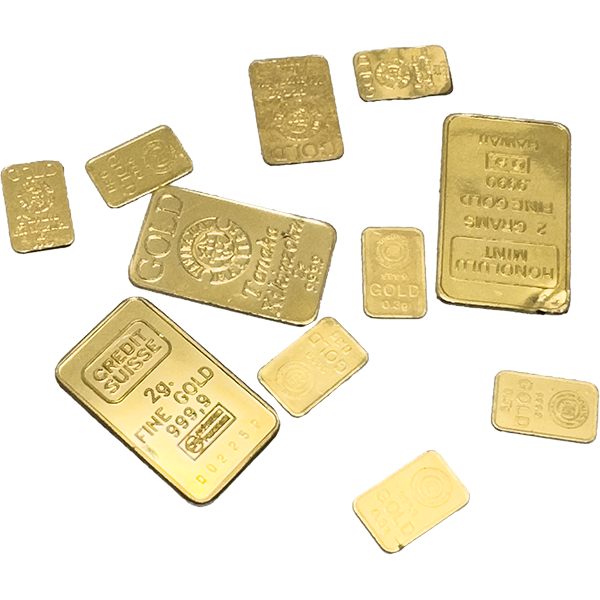
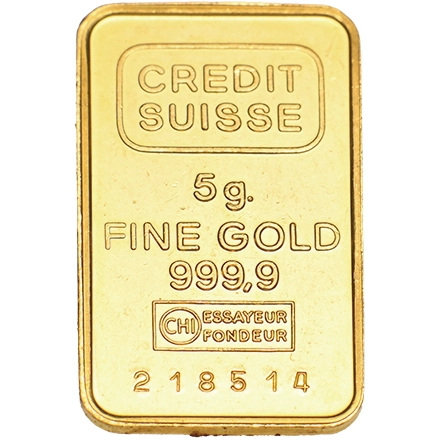
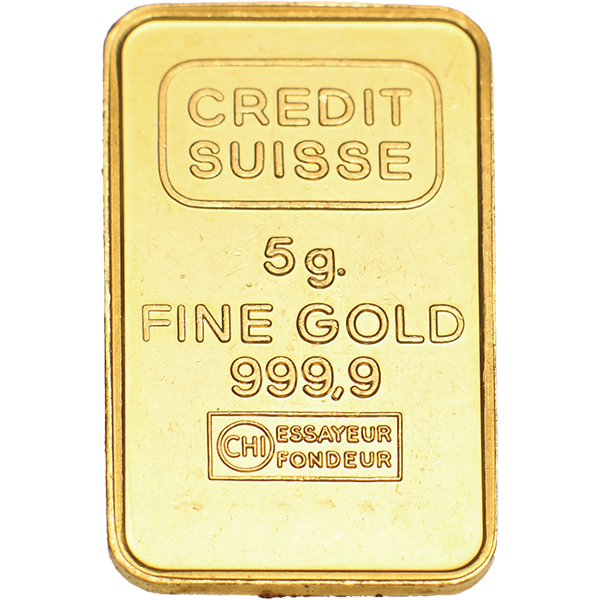
*Images are for illustrative purposes only.
*Reference purchase price applies only when the hallmarked purity matches the specific gravity reading.
ingot Reference Price List
*Reference purchase price applies only when the hallmarked purity matches the specific gravity reading.
What is the reason why Gold is considered to be
at the best time to sell?
The price of gold recorded its lowest value of JPY865 in 1998 but has been on a steady upward trend ever since, reaching record highs as of December 2023, partly due to uncertainties such as the COVID-19 pandemic. Gold prices remain at a high level today.
With the ongoing uncertainty surrounding the end of the COVID-19 pandemic and global political instability, it is expected that gold prices will continue to trend high due to various concerns about the future. However, it is also possible for the market to experience a decline if gold is sold off to secure cash temporarily.
Given the current surge in prices, now may be the ideal time to sell your gold.
Visit a Specialized Purchase Store Otakaraya
to Sell and Appraise Your Gold


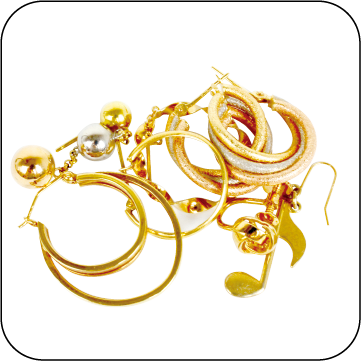
ANY CONDITION!
Don't give up just because
it's
"BROKEN," "DIRTY" or "OLD"!
OTAKARAYA enchancing purchase offers
for gold items in any condition!

for PURCHASE!

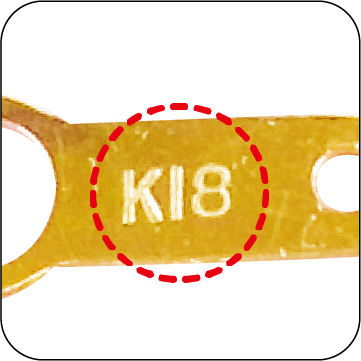
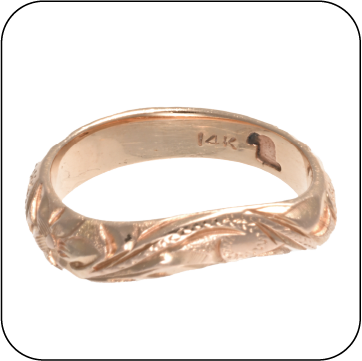
Gold without
a stamp
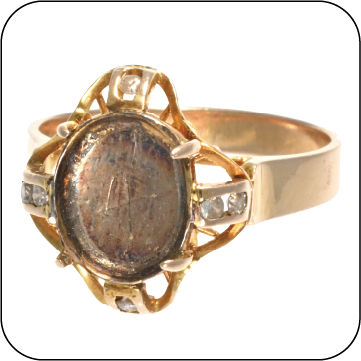
Rings with
missing stones
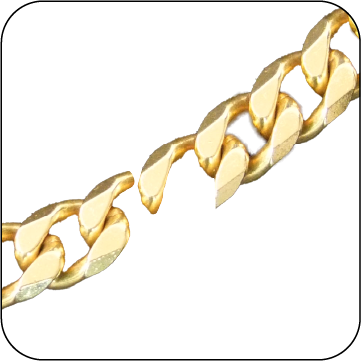
Bent or
torn gold
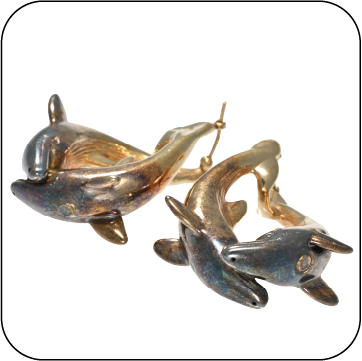
Tarnished
accessories
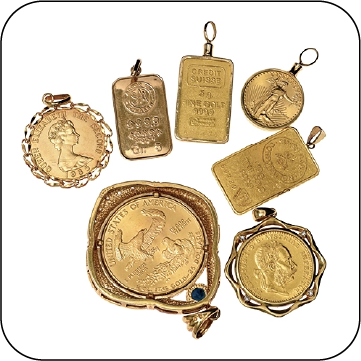
Pendant tops only
small
amounts of gold
Antique value considered
distorted accessory
Would you like to know
the value of your gold
and precious metals?
the value of your gold
and precious metals?
Free appraisal
by "Otakaraya"
by "Otakaraya"
the high-price
purchase
professionals.
purchase
professionals.
Available 24/7 for free!
Get an appraisal with just one photo!
Consultations are very welcome!
Get an appraisal with just one photo!
Consultations are very welcome!
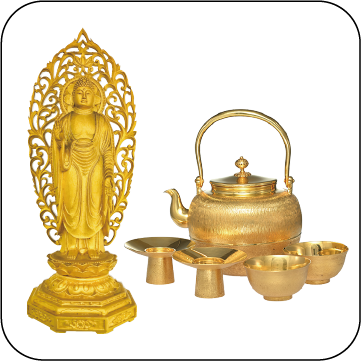
Types of Gold & Precious Metals Customers Can Sell at OTAKARAYA
At OTAKARAYA, we buy a wide variety of gold.
Browse by Gold & Precious Metal Purchase Items
Search by Gemstone and Colored Stone
Search by Jewelry Brand Name
Would you like to know
the value of your gold
and precious metals?
the value of your gold
and precious metals?
Free appraisal
by "Otakaraya"
by "Otakaraya"
the high-price
purchase
professionals.
purchase
professionals.
Available 24/7 for free!
Get an appraisal with just one photo!
Consultations are very welcome!
Get an appraisal with just one photo!
Consultations are very welcome!
Search from OTAKARAYA's Purchase Items
Gold Purchase
Platinum Purchase
Diamond / Jewellery
Purchase
Brand Watch Purchase
Brand Item Purchase